
-
How good is this, really?
We characterize backtesting statistical performance in terms of the fraction of the number of winning trades divided by the total number of trades (% Winning Trades) and the fraction of the gross dollar gains divided by gross dollar losses (Profit Factor).Imagine tossing a coin where the probability of heads is equal to the '% of Winning Trades' and the cumulative winnings on heads divided by cumulative losses on tails is the 'Profit Factor'.
The following performance factors are computed based on a 12 month trading period of the S&P500 using the position size and portfolio management strategy described in Portfolio Strategy.
You can view the raw backtesting data for the performance metrics by selecting the period ending date.
Period Ending Profit Factor Winning Trades Aug 12, 2016 5.7 75% Oct 14, 2017 5.9 69%
Backtesting Notes:
a) Sufficient capital is available for holding concurrent trading positions.
b) Stocks are bought and sold at the next day opening price upon a buy or sell signal. No buy limit or stop losses are used.
c) A zero net gain is counted as a win, although this is rare.
d) Dollar position sizes are similar for all trades.
e) Impact of commission fee is a small negative impact on the profit factor.
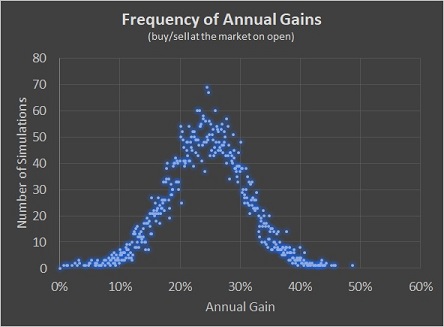
As in many real-world forecasting scenarios, future stock prices are not known yet traders value predictable performance in their trading accounts. If we assume the above 12 month performance metrics hold in the future we can use a Monte Carlo trading simulation to determine the expected range of future portfolio gains. If we blindly buy and sell upon a signal at the open with no stops or limits we would expect, on average, an annual gain of 25%. (see below)
IMPORTANT NOTICE! No representation is being made that the use of this strategy or any system or trading methodology will generate profits. Past performance is not necessarily indicative of future results. There is substantial risk of loss associated with trading securities and options on equities. Only risk capital should be used to trade. Trading futures, options, futures, forex, and securities is not suitable for everyone. Disclaimer: Futures, Options, Securities and Currency trading all have large potential rewards, but they also have large potential risk. You must be aware of the risks and be willing to accept them in order to invest in these markets. Don’t trade with money you can’t afford to lose. This website is neither a solicitation nor an offer to Buy/Sell futures, options, stocks, or currencies. No representation is being made that any account will or is likely to achieve profits or losses similar to those discussed on this web site. The past performance of any trading system or methodology is not necessarily indicative of future results.
CFTC RULE 4.41 - These results are based on simulated or hypothetical performance results that have certain inherent limitations. Unlike the results shown in an actual performance record, these results do not represent actual trading. Also, because these trades have not actually been executed, these results may have under-or over-compensated for the impact, if any, of certain market factors, such as lack of liquidity. Simulated or hypothetical trading programs in general are also subject to the fact that they are designed with the benefit of hindsight. No representation is being made that any account will or is likely to achieve profits or losses similar to these being shown.
-
When do I sell?
Swing trades are designed to last typically from 2 to 20 trading days. Unlike Buy and Hold strategies you only keep your money working when there is price movement. Assume that some of your capital will NOT always be in play. Therefore, we look for daily gains in excess of 0.5%, as a gain of 0.5% per day will double your portfolio's value in one year. Sell all or part of your position once you make 3% or more. If the price is still trending after three percent keep your stop loss tight. Always keep a Sell Stop order to protect your initial capital. Remember that market conditions such as opening price gaps and 'flash crash' events can prevent you from selling your stock at your desired price. However, the fixed price of sell stop orders may reduce the risk of selling your stock in the trough of a sudden market dip or flash crash. -
What if the buy order is not executed on the day of the order?
The trade signal will usually disappear within one trading day. If the signal does disappear the thesis of imminent price movement has weakened. Any opened buy orders should be carefully monitored as new momentum may be delayed several days. Cancel the order if unfilled after 5 days or more. -
What to do with a sell tip?
To keep things simple Stocksaurus is reporting 'Long' Trade Signals. A Sell Stop price is computed when the data shows a pattern that historically leads to a downward trend. Use this price in a 'Stop Limit' order to protect your positions if you are 'long' (holding) the stock. You may use the same price as a 'Sell Short' price if you are inclined to short stocks. The trade signal will usually disappear within one trading day. If the signal does disappear the thesis of imminent price movement has weakened. Any opened sell stop orders may remain to protect gains. If the stock price allows, you should continue to move the sell stop price higher or use a trailing stop loss order to protect your position. -
Why do some signals seem contrary to what the chart shows?
Stocksaurus may find that an artificial intelligence-based strategy produces the best results on backtesting as opposed to using technically based signals. You may even see a buy signal in a strong downtrend. In this case the signal is based on learning an association of a near term price reversal with a complex data pattern that may not be readily apparent in reviewing standard charts and technical metrics. -
Why can't I add my own stocks?
Stocksaurus uses the S&P500 and select ETFs to insure that fundamentals and trading volumes are sufficient to minimize the risk of large price gaps at the open due to low-volume stocks or very inefficient pricing patterns. Undesireable price crashes and gaps are generally inconsistent with an efficient market more assoicated with larger volumes. -
Why is the service cost so low?
Stocksaurus uses cloud computing. The computers are well kept in a comfortable environment with clean stable power. They live happy and healthy lives and don't ask for much in return so our operating costs are relatively low. This allows us to price Stocksaurus to provide exceptional value even when compared to services costing ten (10) times as much. -
What is going on behind the scenes to create these signals?
Stocksaurus uses signal processing and machine learning along with technical trading know-how to uncover signals for likely directional trends. Here is our back-end at work: Click here